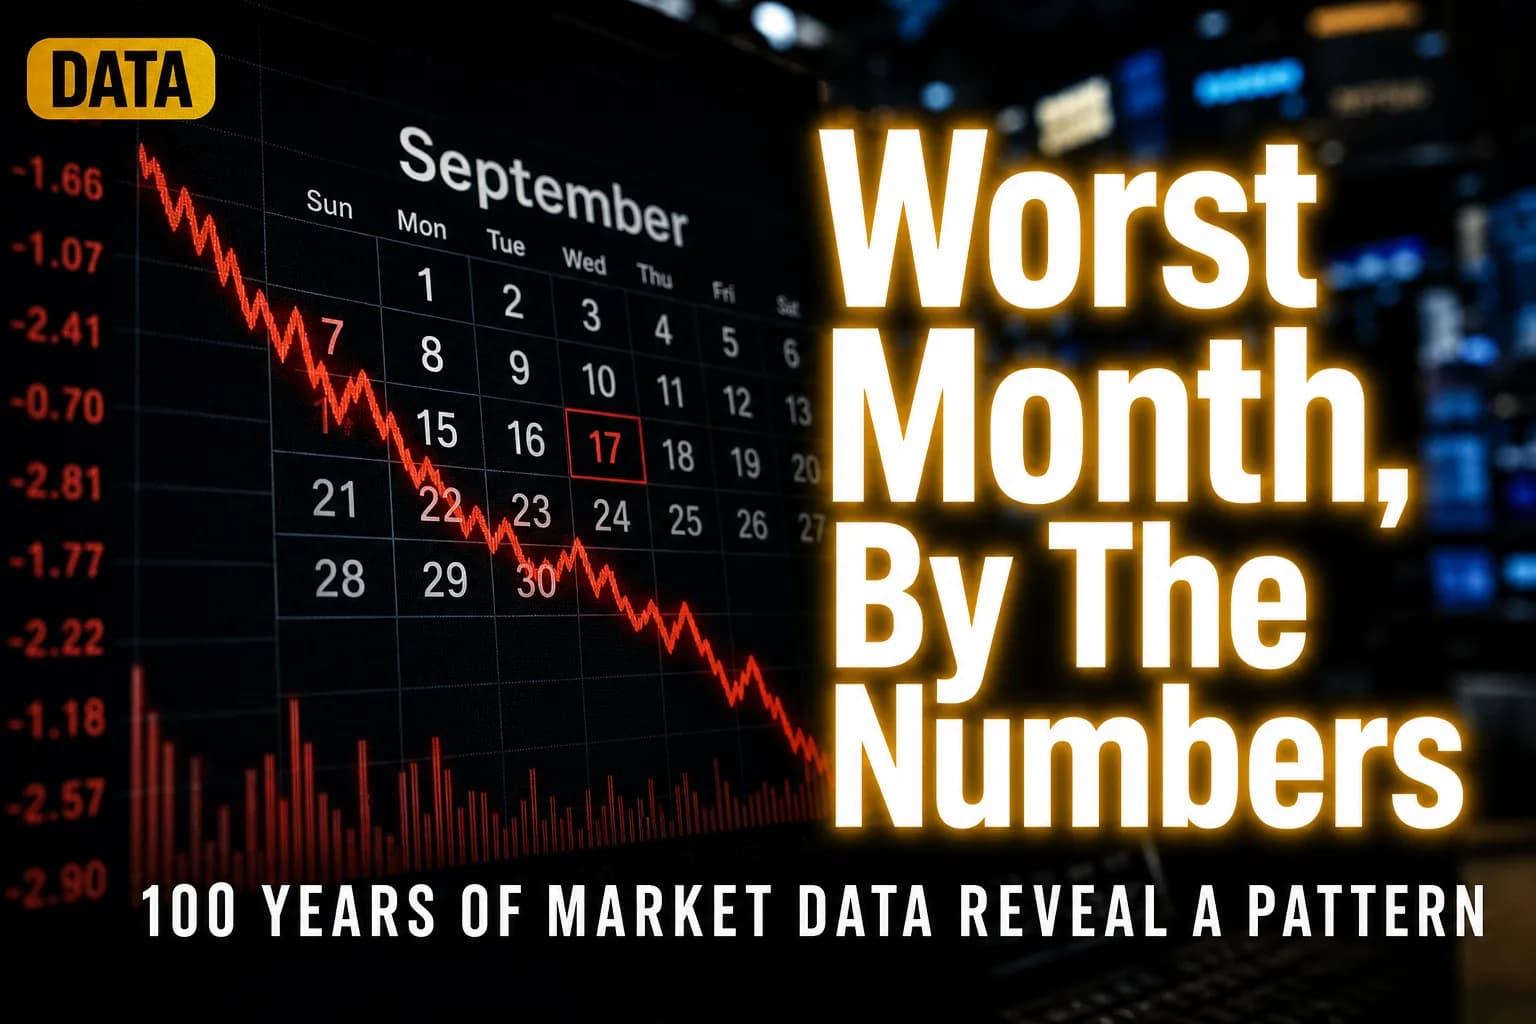
The S&P 500 has averaged a -1.2% return in September since 1928 — the only calendar month with a negative average going back nearly a century. No other month comes close to that consistency of underperformance, and the pattern shows up across almost every major index, in nearly every decade, regardless of who's president or what the Fed is doing.
That statistic is the entire reason "stock market worst months" spikes as a search term every late summer. Someone reads a headline, feels a flicker of dread about their 401(k), and wants to know if this is a real, exploitable pattern or just financial folklore dressed up as data. The honest answer is more interesting than either extreme.
What Are Actually the Stock Market's Worst Months?
Using S&P 500 total return data from 1928 through 2023, three months stand out as consistently weak: September, February, and August. September is the only one with a negative average return across the full sample — roughly -1% to -1.2% depending on the exact window measured.
August and February don't average losses outright, but they carry more volatility and more instances of sharp drawdowns than the rest of the calendar. October gets unfair blame because it hosts the most famous crashes — 1929, 1987, 2008's continuation — but October's average monthly return over the same century is actually positive. It's a high-variance month, not a reliably bad one.
Here's the ranking that actually holds up across multiple data sources (Yale's International Center for Finance, Stock Trader's Almanac, and LPL Research all converge on similar figures):
- Worst average: September (~-1.0% to -1.2%)
- Second weakest: August (slightly positive to flat, high volatility)
- Third: February (mixed, often flat to slightly negative)
- Best average: November and December, followed closely by April
November through January — the so-called "Santa Claus" stretch bridging into the new year — has historically outperformed the rest of the calendar by a wide margin, a pattern well-documented enough that it has its own name on Wall Street trading desks.

calendar with red stock chart declining.
Why Does September Underperform So Reliably?
Nobody has a fully satisfying answer, and that's worth sitting with rather than papering over with a confident-sounding theory. The most cited explanations fall into a few camps.
Mutual fund tax-loss harvesting. Many funds have an October 31 fiscal year-end, which pushes portfolio managers to sell underperforming positions in September to lock in losses for tax purposes ahead of year-end reporting. This creates real, mechanical selling pressure independent of company fundamentals.
Return from summer trading lulls. Trading volume typically thins out in July and August as institutional desks run lighter staffing. When full volume returns in September, any building anxiety about Q4 guidance, earnings, or macro data gets expressed all at once, concentrating volatility into a few weeks.
Historical anchoring and self-fulfilling behavior. Traders know September has a bad reputation. Some of that reputation may now perpetuate itself — algorithmic strategies and quant funds that trade on seasonality data can amplify a pattern simply by trading around the expectation of it.
Genuine macro coincidence. The Federal Reserve's September meeting has historically been a pivot point for policy surprises, and companies often pre-announce disappointing guidance right before Q3 earnings season kicks off in October. Some years this is coincidence. Some years it's structural.
None of these explanations individually accounts for a century of data. Together they form a plausible but imperfect picture — which is precisely why relying on seasonality as an investment strategy is far riskier than treating it as background context.
Does the September Effect Actually Predict This Year?
No, and the data itself proves this. In any given September, the S&P 500 has finished positive roughly 44% of the time since 1950 — meaning the "worst month" label describes an average across many years, not a reliable forecast for any single year.
Compare individual years: September 2010 returned +8.8%. September 2022 fell -9.3%. September 2023 dropped -4.9%. September 2024 posted a modest gain. The variance dwarfs the average, which is the core statistical problem with using seasonality to time trades.
Behavioral economists call this the difference between a base rate and a prediction. Knowing that houses in a neighborhood average $450,000 tells you nothing about whether the specific house you're considering is a good deal. Knowing September averages -1% tells you nothing reliable about what happens between September 1 and September 30 this year.
"Seasonality is a real statistical phenomenon and a terrible market-timing tool. Those two things are both true at once." — a framing echoed across research from Fidelity, Vanguard, and virtually every major institutional strategy desk.
What Should Long-Term Investors Actually Do With This Information?
The data supports one clear conclusion: reacting to "worst month" headlines by moving to cash has historically cost investors more than it saved them. A widely cited J.P. Guided Wealth Management analysis found that missing just the 10 best trading days over a 20-year period cut total returns roughly in half — and several of those best days occurred during or immediately after the market's supposedly worst stretches.